Apps for event studies and news analytics
EventStudyTools helps you perform event studies and news analytics analyses. Its research apps calculate all metrics needed for scientific publications (see sample results) of return and volume event studies, focused on single or multiple events.
You can access the research apps online on this website or locally via our application programming interface (API).
While our website summarizes and lists the underlying research, team members also help improve event study test statistics (available in our result outputs).
Use our Award-winning research apps!
Explore how you can make your research more innovative with our research apps and review publications that cite us on Google Scholar - such as this A+ ranked article.
Join the scholars who have saved countless hours of coding by using EventStudyTools' research apps.
Get full access
Access options for individuals
Institutions
Why our research apps
- Our apps will help you get published - see Google Scholar
- They are easy to use, without any need for coding
- You will receive all test statistics needed for your publication
- We offer the channel that matches your needs: Web/graphical user interface (GUI) and direct API implementation
- Our apps are fairly priced at 9 USD for a full month of unlimited use
- Transparent one-month one-off access with no automatic extensions
- Free student access at whitelisted institutions
- Full privacy, no personal data is stored. Only the hash value of your email is kept on our server as your key for accessing our research apps
- Help and FAQ Portal to guide you from gaining access, over building your input files, to interpreting the test statistics of your analysis
Watch the Chinese version of this introduction on youtube.
Features of abnormal return calculator
- Ideal for sample studies: In one analysis run, you can study a large number of events at different dates and cluster them by sub-groups
- Large choice of expected return models, including the market model and various multi-factor models
- Test statistics at the AR-, CAR-, AAR-, and CAAR-levels
- P-values for all test statistics to assess significance levels
- Our results include novel permutation tests
- Validated against other solutions and published research papers
- Automatic adjustments for non-trading event dates, for example, an automatic switch to the subsequent trading day
- You can choose between simple and log returns
- Data file compilation service to help you create your input data files
- Free basic abnormal return calculator (bARC) to try out the analysis process through our GUI
- Market Model
- Market Adjusted
- Comparison Period Mean Adjusted
- Capital Asset Pricing Model (CAPM)
- Fama-French 3 Factor Model
- Fama-French-Momentum 4 Factor Model
- Fama-French 5 Factor Model
- T Test
- Cross-Sectional T
- Crude Dependence Adjustment T
- Patell Z
- Adjusted Patell Z
- BMP/Standardized Cross-Sectional Test
- Adjusted Standardized Cross-Sectional Test
- Skewness Corrected
- Rank Z
- Generalized Rank Z
- Generalized Rank T
- Sign Z
- Generalized Sign Z
- Wilcoxon
- Permutation Tests
- Automatic non-trading day adjustments
- Choice between simple and log-returns
- Optional data file creation service
Workflow for an event study when using our web interface
Performing event studies with EventStudyTools is simple. You only need to parameterize your analysis and upload the financial data (example), which you can retrieve at one of the free financial data providers (e.g., Yahoo!Finance). EST then does the work and sends you the results to your email, incl. all test statistics needed for publishing your work (example). Figure 1 illustrates this workflow. We offer three event study apps: An abnormal return calculator (ARC) for return event studies, an abnormal volume calculator (AVC) for event studies on trading volumes, and an abnormal volatility calculator (AVyC) for volatility event studies.

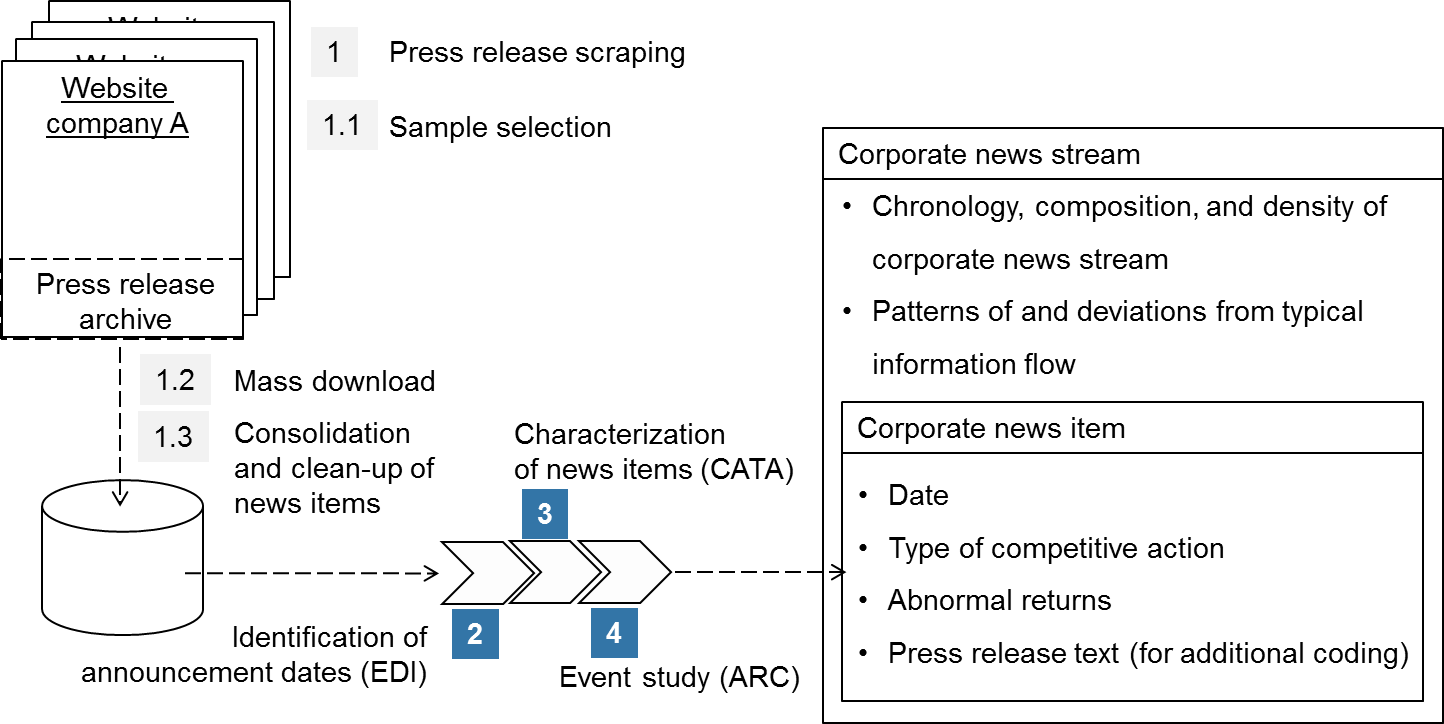
News Analytics
News analytics describes the analysis of news streams aimed at turning news into quantitative metrics and time-series. As a quantitative research approach, news analytics can be well combined with event studies that capture the market responses to the corresponding news. This combination of methods also has practical applications, such as news-based trading or peer group monitoring. The below figure illustrates the news analytics capabilities available to you on EventStudyTools.