In short: event studies let researchers measure how the market reacts to competitive actions, such as a rival's move or a firm's strategic response, through abnormal returns around the action's date. This page covers the competitive-dynamics use case and how to run the analysis. Run it free in ARC.
Competitive dynamics is the study of the causes and consequences of interfirm rivalry: how firms attack, respond, and signal to one another, and how those competitive actions translate into performance (Thomas and Pollock, 1999; Young et al., 1996). For an event study, this perspective has two complementary applications. First, a focal firm's corporate event (a bankruptcy, a merger, an earnings surprise) is rarely contained within that firm: it re-prices its rivals, and the sign of the rivals' reaction reveals whether the news is read as a shared industry signal (contagion) or as a shift in competitive position (a competitive effect). Second, a firm's own stream of competitive actions (price cuts, product launches, capacity moves) is itself a sequence of dated, public events whose market valuation can be measured. This page covers both: the intra-industry information-transfer evidence on rival reactions, and the strategic-management literature on competitive actions and their market consequences.
The event study method is the natural tool here because each competitive event is a discrete, dated, largely unanticipated piece of public information. The method isolates the abnormal return attributable to the event from normal market-wide movement, so it can quantify both how a focal firm's news spills over to competitors and how the market prices a firm's own competitive behavior.
In one sentence: when a corporate event hits one firm, the sign of its rivals' abnormal returns is an empirical test of whether the market reads the news as bad for the whole industry (contagion, same-direction returns) or as one firm's loss becoming another's gain (a competitive or business-stealing effect, opposite-direction returns), and the same machinery prices a firm's own stream of competitive moves.
Seminal findings at a glance
The table collects the load-bearing magnitudes from the canonical studies so the rest of the page can reference exact numbers rather than directional claims. Each figure is verified against the primary source; attributions that are commonly muddled (in particular which paper reports the three-day bankruptcy figure) are pinned to the correct study below.
| Study and event | Sample | Headline rival result |
|---|---|---|
| Lang and Stulz (1992): Chapter 11 bankruptcy | Value-weighted competitor portfolios, 1970-1989 | Competitor portfolio falls about -1% at the announcement (significant); the reaction turns significantly positive, about +2.2%, in highly concentrated, low-leverage industries. |
| Ferris, Jayaraman and Makhija (1997): Chapter 11 filing | Intra-industry competitors around the filing | Value-weighted competitor portfolio loses -0.56% over the 3-day filing window (significant); equally weighted -0.12%; competitors collectively lose about $3.32 for every $1 of value lost by the bankrupt firm. |
| Eckbo (1983): horizontal mergers | About 100 horizontal Section 7 antitrust cases, 1963-1982, about 15 listed rivals each | Rivals earn a small positive abnormal return at the merger proposal (about +2.45% over the proposal window) but show no negative reaction when the antitrust complaint is filed: the non-reaction rejects collusion. |
| Foster (1981): earnings releases | Founding intra-industry information-transfer study | Non-announcing peers move in the same direction as the announcer; the transfer scales with the peer's share of revenue in the announcer's line of business. |
| Song and Walkling (2000): takeover targets | Rivals of initial acquisition targets | Rivals earn positive returns regardless of the form and outcome of the deal, rising with bid surprise and largest for rivals later acquired; nearly half of rivals show no positive effect (the mean hides wide spread). |
| Hertzel et al. (2008): vertical distress (Fama-DFA Prize) | Suppliers of Chapter 11 filers | Suppliers earn negative, significant abnormal returns concentrated at the filing date; the earlier value-loss-date reaction is under half the magnitude and only about 10% significant. |
| Klein (2020): modern TNIC mergers | 1,751 large U.S. mergers since 1997, TNIC competitor sets | Likely competitors earn on average close to +1% around announcement, associated with anticipated market-power effects rather than pure efficiency. |
What the research shows: contagion versus competitive effects on rivals
The defining idea of the intra-industry literature is that a single corporate event carries two offsetting cross-firm signals. A contagion (information-spillover) effect pushes rivals' returns in the same direction as the announcing firm, because the news revises beliefs about industry-wide prospects. A competitive (market-share or market-power) effect pushes rivals in the opposite direction, because one firm's misfortune is a survivor's opportunity (and one firm's gain is a competitor's threat). The net rival reaction is the difference of these two forces, so it is typically small in magnitude, and its sign is an economic test rather than a foregone conclusion. The intuition comes straight from Foster (1981): the more a peer's business overlaps the announcer's, the more news transfers, so the spillover sign and size are, at bottom, an empirical similarity test.
Bankruptcy: contagion dominates on average, competitive effect in concentrated industries
The canonical paper is Lang and Stulz (1992), which studies how Chapter 11 filings move a value-weighted portfolio of same-industry competitors. The verified headline is that bankruptcy announcements decrease the value of a value-weighted portfolio of competitors by about 1% at the announcement, a statistically significant net-negative reaction in which contagion dominates. The effect is significantly more negative in highly levered industries and where bankrupt and non-bankrupt firms' returns are highly correlated. Critically, the reaction flips significantly positive (about +2.2%) in highly concentrated, low-leverage industries, where surviving rivals are expected to absorb the failing firm's business: there the competitive effect outweighs contagion. The cross-sectional switch between the two regimes is governed by industry structure: rival returns rise with concentration (the Herfindahl index) and fall with industry leverage and intra-industry return correlation.
The cleanest short-window magnitudes, and a vivid spillover statistic, come from Ferris, Jayaraman and Makhija (1997), who replicate and extend Lang and Stulz. They report that the value-weighted competitor portfolio loses a significant -0.56% in the three days centered on the filing (the equally weighted portfolio loses -0.12%), and they quantify the magnitude of the spillover directly: competitors collectively lose about $3.32 for every $1 of value lost by the bankrupt firm. (The widely quoted -0.56% three-day figure belongs to this paper, not to Lang and Stulz, whose verified headline is the roughly -1% announcement-window number.) Contagion dominates for the average bankruptcy, while competitive (positive) reactions concentrate where the failing firm's market share is contestable.
Distress contagion also propagates vertically, not only across same-industry rivals. Hertzel, Li, Officer and Rodgers (2008), a Fama-DFA Prize paper, show that suppliers of a filing firm earn negative, significant abnormal returns around the filing, with the reaction concentrated at the filing date itself: the reaction on the earlier value-loss date is less than half the magnitude and only about 10% significant. Supplier losses are larger when horizontal contagion among the filer's rivals is more severe, connecting the rival channel to the supply-chain channel.
Earnings releases: the origin of intra-industry information transfer
The literature begins with Foster (1981), who established that a firm's earnings release moves the stock prices of non-announcing peers in the same industry: announcements carry industry-wide, not just firm-specific, information. The transfer is same-direction (contagion-dominated) and, in Foster's own operationalization, scales with the peer's percentage of revenue in the announcer's line of business: peers with more of their business in the announcer's line react more. This is the cleanest case of a near-pure information channel with little offsetting competitive effect, and it is the foundational motivation for studying rivals at all.
This channel is not a historical footnote. Intra-industry information transfer is now the leading limited-attention explanation for post-earnings-announcement drift: Tan et al. (2019), on a 1996-2015 sample, show that same-industry peer earnings announcements drive a large part of analyst-forecast-based drift, with the mechanism being investor limited attention rather than accounting conservatism. Foster's 1981 result has thus become a connection to a live, unsolved anomaly.
Horizontal mergers and takeover targets: positive rival returns, and what they mean
Rivals of merging or targeted firms generally earn positive abnormal returns, but the interpretation requires care. Eckbo (1983) uses rivals' abnormal returns as an economic-content test on about 100 horizontal Section 7 antitrust cases from 1963 to 1982, with roughly 15 listed rivals per merger. The logic is a two-event-date design: if a horizontal merger were anticompetitive (collusion or output restriction), rivals should gain at the proposal and lose when an antitrust complaint lowers the deal's probability. The empirical result is that rivals earn a small positive abnormal return at the merger proposal (about +2.45% over the proposal window) but show no negative reaction when the antitrust complaint is filed. The decisive evidence is the non-reaction at the complaint, not the positive sign at the proposal: because collusion predicts rivals should fall when a collusive deal is blocked and they do not, collusion is rejected, and positive rival returns are better read as efficiency or industry-revaluation signals. This establishes the general logic that the sign and sequence of rivals' CARs across multiple event dates discriminates between competing hypotheses.
For takeovers, Song and Walkling (2000) document the acquisition-probability hypothesis: rivals of an initial target earn positive abnormal returns, regardless of the form and outcome of the deal, because the event raises their own probability of becoming a target. Rival CARs increase with the surprise of the initial bid and are largest for rivals that are subsequently acquired, giving a clean, mechanism-based reading of a positive competitive or anticipation spillover. A crucial caution: nearly half of rival firms show no positive effect at all, so the average masks enormous cross-sectional heterogeneity. A second caution follows from the anticipation channel itself: part of a positive rival CAR is not a reaction to this deal but a re-pricing of the rival's own probability of being next in a consolidation wave, so the measured abnormal return blends a competitive signal with a forward-looking takeover premium. Designs that want to isolate the competitive effect should control for each rival's ex-ante takeover likelihood, or study deals that are unlikely to trigger further consolidation.
The effect generalizes across event types
Intra-industry spillovers are pervasive. Laux, Starks and Yoon (1998) decompose rival reactions to large dividend revisions and show that for rivals less exposed to competitive realignment the reaction mirrors the announcer (contagion), while for closely competing rivals competitive effects offset contagion, yielding muted or opposite-sign reactions: the relative weight of the two effects is itself the object of estimation. Akhigbe and Madura (1999) document significantly positive intra-industry revaluations of rival banks around acquisition announcements, larger for smaller, poorer-performing rivals and for rivals subsequently acquired within two years: the mechanism is the acquisition-probability and valuation-signal channel, not a pure competitive effect, which reinforces the design rule to control each rival's ex-ante takeover likelihood when isolating the competitive force. Related studies document intra-industry valuation signals across many event types (bank acquisitions, IPOs, bond-rating changes, dividend and earnings surprises), with the net sign depending on rival similarity and the information content of the event.
Modern events: data breaches, product recalls, and regulatory approvals
The two-force logic extends cleanly to twenty-first-century event types, where it doubles as a similarity test. When a retailer suffers a data breach, peers can lose value (shoppers fear the whole channel is unsafe: contagion) or gain it (shoppers switch to perceived-safer rivals: business-stealing). Kashmiri, Nicol and Hsu (2017) study the 2013 Target breach and find significantly negative abnormal returns for roughly 168 same-sector retailers, with losses larger for rivals more similar to Target and for larger firms: contagion dominated, and similarity scaled it. The 2017 Equifax breach is a natural companion case in a concentrated three-firm credit-bureau oligopoly, where the same design isolates whether rivals were tarred by association or gained relative standing. Beyond single cases, a meta-analysis by Ali et al. (2022), covering 63 studies and 20,936 breach-announcement instances, confirms a significant negative reaction for breached firms, moderated by breach type, time period, geography, and firm size. Notably, the sector-wide spillover to non-breached rivals is significant and growing over 2006-2016 in longitudinal work, an anti-decay result that should temper any prior that markets have learned these spillovers away.
Product recalls show the cleanest sign-flip. A recall can spill over negatively (consumers distrust the product category) or positively (the recalling firm's customers defect to rivals). Modern broad-sample recall studies (2021 and 2024) find a net negative spillover on competitors on average (contagion dominates, and recalling firms themselves lose on the order of -0.5%), but the competitive (business-stealing) effect strengthens and can dominate when product hazards are severe or the recalling firm handles the recall passively rather than proactively. Regulatory approvals are the mirror image of a positive focal event: an FDA approval for one drug can be negative for the direct head-to-head competitor it displaces, yet positive for class peers whose own pipeline is de-risked by the precedent, and markets typically react far more to trial failures than to successes. In each case the rivals' CAR sign is the empirical answer to a strategic question, not an assumption.
The general rule for interpretation is summarized below. A negative focal event (bankruptcy, recall, breach) with positive rival CARs indicates business-stealing, with negative rival CARs indicates contagion; a positive focal event (merger, approval, favorable earnings) reverses the reading. The rule of thumb: a same-direction rival reaction is contagion (shared news); an opposite-direction reaction is competitive (business-stealing or threat); and the closer the rival, the more the competitive force bites.
| Focal event direction | Rival CAR positive | Rival CAR negative |
|---|---|---|
| Negative focal event (bankruptcy, breach, recall) |
Competitive effect: rivals steal the distressed firm's business or customers. | Contagion: the market re-rates the whole industry downward. |
| Positive focal event (merger, FDA approval, earnings beat) |
Contagion / anticipation: shared good news, or rivals seen as next consolidation targets. | Competitive effect: the focal firm's gain is the rival's lost position. |
Recent and meta evidence (2010 onward): how the magnitudes have held up
The canonical studies stop in the 1980s and 1990s. Since 2010 the field has re-estimated these effects on modern samples with better competitor identification, produced genuine meta-analyses, and documented real anomaly decay in the closely related cross-firm-predictability literature. The short version: the canonical signs largely replicate, but magnitudes and interpretations have sharpened, and the net sign can flip when competitors are identified more precisely.
The clearest modernization of Eckbo is Klein (2020), who applies Hoberg-Phillips Text-based Network Industry Classification (TNIC) competitor sets to 1,751 of the largest U.S. mergers since 1997. Likely competitors earn on average an abnormal return close to +1% around the announcement, and crucially the rival CAR is strongly associated with market-power concerns: rivals appear to gain partly from anticipated anti-competitive effects (that is, from too-lenient merger control), not pure efficiency. This both updates Eckbo for the modern era and gives a concrete payoff to the page's TNIC recommendation: better competitor identification does not merely refine a standard error, it can change the economic interpretation of a published result.
Two meta-analyses now anchor strands the page previously rested on single studies. On the strategy side, Hughes-Morgan, Kolev and McNamara (2018), the first meta-analysis of the competitive-aggressiveness literature, find that competitive volume reliably improves operating performance and that aggressiveness is positively associated with performance overall, with larger and older firms, lower slack, higher market growth, lower concentration, and more heterogeneous top teams acting more aggressively. That positive relationship is not unconditional: Andrevski and Ferrier (2019), a re-test by Ferrier himself, show the performance payoff to aggressiveness is contingent on internal and external resources, and excessive aggressiveness can escalate costs and lower performance for some firms. On the breach side, the Ali et al. (2022) meta-analysis supplies the sector-level number that a single case study cannot.
Anomaly decay and sample-period robustness
A caution the canonical pages omit: cross-firm spillover and predictability magnitudes are sample-dependent, and some have decayed. The customer-supplier link of Cohen and Frazzini (2008) earned more than 150 basis points per month over 1981-2004, but recent re-examination finds the predictability concentrates in the first week, does not hold for the largest supplier stocks, and has disappeared for negative events in more recent samples; customer-momentum strategies survive at a more modest 106 to 122 basis points per month. The lesson for any rival event study is direct: do not import 1980s and 1990s magnitudes wholesale onto a modern sample. Re-estimate per sample period, and treat better competitor identification (TNIC re-estimation) as something that can flip the measured net sign rather than merely sharpen it.
The decay point should be balanced against the opposite finding for genuinely new event types. As noted above, sector-wide data-breach contagion to non-breached rivals is significant and growing over 2006-2016. The nuanced claim, then, is that some cross-firm effects decay (predictability that depended on slow information diffusion) while others strengthen (genuine contagion in new event types), so the practitioner's default is to measure on current data rather than assume.
What the research shows: competitive actions, responses, and their market valuation
The strategic-management half of this use case focuses on the focal firm's own competitive behavior. Contrasting the structural emphasis of industrial organization, the competitive dynamics perspective opens the black box of firm behavior and treats the dynamic exchange of competitive actions between firms as its object of interest (Ketchen et al., 2004). It assumes a notion of competition matching Schumpeterian and Austrian economics (Kirzner, 1997; Mises, 1949), in which "the fundamental impulse that sets and keeps the capitalist engine in motion comes from the new consumers' goods, the new methods of production or transportation, the new markets, the new forms of industrial organization that capitalist enterprise creates" (Schumpeter, 1943: 83), so that firm performance results from an ongoing struggle among firms (Kirzner, 1973). Figure 1 places the perspective relative to other theories of interfirm rivalry.
Figure 1: Theoretical Perspectives on Interfirm Rivalry
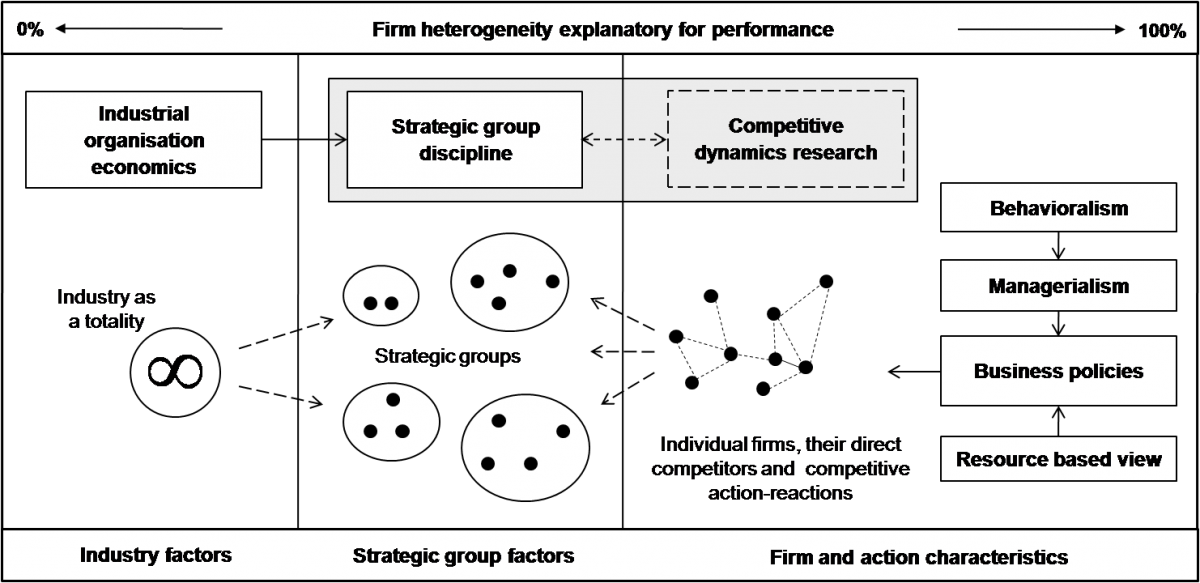
Source: Schimmer (2012: 12)
To capture the action and turbulence of competitive interplay and to set their interpretation apart from the static notion in economics, competitive dynamics scholars revitalized the term "interfirm rivalry" (Bettis and Weeks, 1987; Porter, 1979) and created metaphors that capture the personal, goal-driven, dynamic notion of rivalry they maintain (Chen, 2009): rivalry as a boxing fight (Ferrier and Lee, 2002), or, with many competitors, as a race in which rivals accelerate from time to time to overtake a specific opponent (Zucchini and Kretschmer, 2011).
The perspective dates to the early 1980s, when scholars first put the dynamic, process-oriented notion of rivalry to an empirical test (Bettis and Weeks, 1987; MacMillan, McCaffrey and Van Wijk, 1985), studying the competitive actions and responses of firms as the central vehicles of rivalry. Fueled by the research program of Professor Chen (1988, 1996; Chen and Hambrick, 1995; Chen and MacMillan, 1992; Chen and Miller, 1994; Chen, Smith and Grimm, 1992), this strand became an established area of research.
Early studies investigated the defining characteristics of competitive moves and how these relate to competitors' responses (Chen and MacMillan, 1992; Chen and Miller, 1994; Chen, Smith and Grimm, 1992). Shared market interest and similar resource profiles raise competitive tension between firms, and action characteristics such as irreversibility, visibility, and the competitor's dependence on the challenged market predict response behavior (Chen, 1996; Chen and MacMillan, 1992; Chen and Miller, 1994). Scholars then complemented action-and-response dyads with the study of longer sequences of competitive moves (Chen and Hambrick, 1995; Ferrier, 2001; Gimeno and Woo, 1996; Miller and Chen, 1994; Rindova, Ferrier and Wiltbank, 2010). Ferrier (2001), the seminal sequence-level study, codes thousands of competitive actions across 16 industries over 7 years and shows that properties of a firm's competitive-action sequence (its aggressiveness, complexity, and variation) explain relative performance, with sequence aggressiveness driven by top-management-team heterogeneity, past performance, slack, and industry growth and concentration. Ferrier, Smith and Grimm (1999) add concrete, magnitude-bearing evidence on dethronement: challengers are more likely to dethrone a market leader when the leader carries out fewer competitive actions, deploys a narrower and simpler action repertoire, and is slower to respond.
The framework that organizes who reacts and why is awareness-motivation-capability (AMC), whose canonical origin is Chen (1996). Chen introduces two firm-pair constructs, market commonality (the overlap and importance of shared markets) and resource similarity, as the antecedents of competitive tension, and reports the load-bearing finding that motivation is a necessary precondition and a more direct and stronger predictor of interfirm rivalry than capability. A competitor responds to a move only if it is aware of it, motivated to react (its market commonality with the actor), and capable of doing so (its resource similarity). The structured-content-analysis method of Smith, Ferrier and Ndofor (2001) operationalizes this by coding competitive actions from news and press releases, which is also the bridge between identifying which rivals act and which rivals react to a focal-firm event.
Competitive action sequences and the focal firm's own returns
The bridge between the strategy and finance halves of this page is direct: capital markets price not only single corporate transactions but also the gestalt of a firm's competitive-action stream. Ferrier and Lee (2002) show that a focal firm's abnormal stock returns depend on properties of its competitive-action sequence (its aggressiveness, its variation or complexity, and its surprise), not on isolated moves. Rindova, Ferrier and Wiltbank (2010) extend this "value from gestalt" logic to nascent markets, where sequences of competitive actions create advantage and shape how the market values the firm. The implication for study design is that, when the "event" is a competitive action rather than a corporate transaction, the unit of analysis can be a stream of moves coded from press releases rather than a single dated announcement.
Video 1: Prof. Walter Ferrier discussing stock market responses to gestalt properties of competitive action sequences
Capturing firms' competitive behavior
One key challenge in this research is capturing the competitive behavior of firms. Besides manually mapping competitive actions over time, automated procedures help get hold of firms' strategic decisions and rivalrous actions: one option collects and identifies competitive actions from firms' online press-release archives, followed by a sequence of steps to systematically map the competitive actions of individual firms or whole industries. Figure 2, taken from Schimmer (2012), illustrates this approach. The same coded actions can then be matched against rival reactions or against the focal firm's own abnormal returns.
Figure 2: Capturing Competitive Behavior
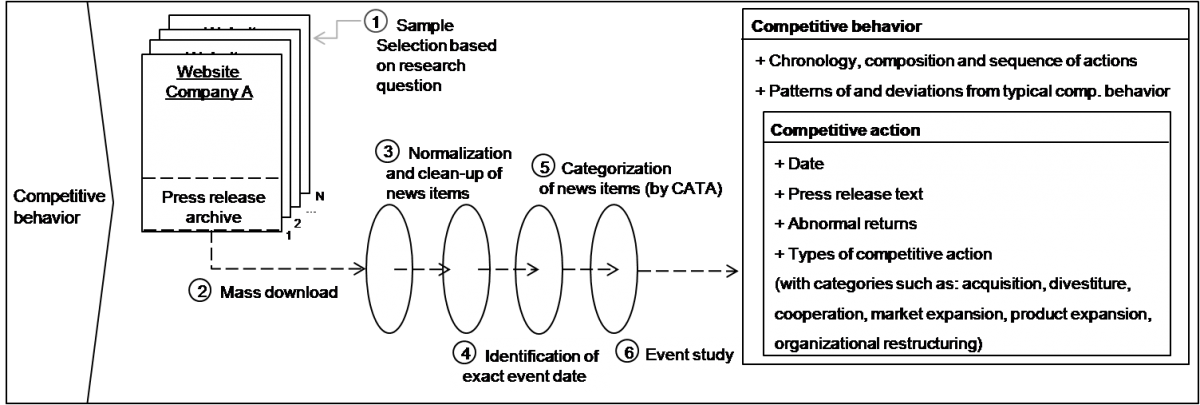
Adapted from Schimmer (2012: 5)
Who uses this in practice, and how
Rival and intra-industry event studies are not only an academic exercise: they are a working tool for three practitioner constituencies, and financial regulators run this methodology in production (event-study software vendors count agencies such as the Office of the Comptroller of the Currency, the Office of Financial Research, and CRSP among their users).
- Antitrust regulators and merger economists (FTC, DOJ). The sign and size of a rival's CAR is treated as a market-power screen: if a deal is anticompetitive, rivals should gain at announcement and lose when an antitrust complaint blocks it. The discriminating design is to run the event study on both the proposal date and the antitrust-challenge date, because the rival's reaction to the block is what separates collusion from efficiency (the Eckbo logic, below).
- Litigators and damages experts. Event studies are the court-accepted standard for materiality and loss causation. The rival and intra-industry design is the same machinery applied to a different question, so it cross-links directly to our litigation and securities-fraud application.
- Buy-side investors and corporate strategists. Contagion and business-stealing trades around breaches and recalls, biotech rival re-pricing on trial and FDA readouts, and competitive-intelligence monitoring of rivals' action streams all map onto the two-force framework on this page.
Boxed case: FTC v. Staples / Office Depot (1997)
A rival's stock return as the answer to a policy question. When the FTC challenged the Staples / Office Depot merger in 1997, economists used the abnormal return of OfficeMax, the only remaining national office-superstore rival, to infer the deal's competitive effect. Treating the rival's large positive abnormal return (reported on the order of +12% attributable to the merger after probability-weighting the merger-related events) as the market's forecast of higher post-merger prices, Warren-Boulton and Dalkir (2001) backed out a predicted office-supply price increase of roughly 6.5% to 6.8%, almost identical to the FTC's independent econometric (pricing-regression) estimate of about 7%. A rival event study and a pricing regression independently reached the same number. The FTC won a preliminary injunction blocking the 3-to-2 merger. This is the canonical demonstration that a rival's CAR can quantify, not merely signal, the competitive effect of a deal.
The regulator's own caveat. The FTC's Bureau of Economics has both used rival stock returns (Schumann's 1989 staff report; the retailing-mergers event-study working paper) and documented their key weakness: positive rival returns are ambiguous, consistent both with collusion (rivals share in higher prices) and with efficiency (rivals signal an industry-wide value driver). A rival event study is therefore a screening tool, not proof of consumer harm. To be probative it should be paired with (i) rivals in unaffected geographic markets as a control for pure efficiency signaling and (ii) direct price evidence. This is exactly the limitation an expert witness or regulator would raise, and it is the reason Eckbo's two-date design (proposal versus challenge) is so valuable: the reaction to the block, not the proposal, is what identifies the mechanism.
How to run this kind of event study
For the conceptual foundations see our introduction to event study methodology; for a step-by-step workflow see the event study application blueprint. The points below are the specifics that matter when the unit of analysis is the rival, not the announcing firm.
- Define the rival set explicitly and defensibly. For each event, identify a peer set (for example all firms sharing the announcer's primary three- or four-digit SIC or NAICS code) and exclude the announcing firm itself. Because nominal industry codes are coarse, better practice layers in product-market similarity, revenue overlap, or analyst coexistence to capture true competitors. The strongest off-the-shelf option is the Text-based Network Industry Classification (TNIC) of Hoberg and Phillips (2016), which builds firm-by-firm similarity scores from 10-K product descriptions and outperforms SIC and NAICS at identifying genuine competitors; the similarity data and competitor sets are publicly downloadable from the Hoberg-Phillips Data Library. Switching from SIC to TNIC can materially change which firms count, and because it sharpens the set toward closer competitors it can flip the measured net sign from contagion to competitive (Klein, 2020).
- Pre-split rivals into a-priori sub-sets by predicted sign before testing. Because the net reaction is the difference of two offsetting forces, pooling all rivals washes the signal to near zero. Split before testing: direct head-to-head versus peripheral peer; high- versus low-Herfindahl industries; high- versus low-leverage; in pharma, the displaced direct competitor (expect negative) versus the de-risked class peer (expect positive). Test each homogeneous sub-set rather than the pooled average, and tie the partition to the Lang and Stulz concentration and leverage signature.
- Choose an aggregation design and state it. There are three valid routes, not two: (a) build one portfolio of rivals per event and treat it as a single return series, commonly value-weighted and rebalanced for composition (Lang and Stulz, 1992); (b) compute each rival's CAR and average across rivals, with a cross-correlation-robust test; or (c) the multivariate regression model (MVRM or SUR) of Schipper and Thompson (1983) and Binder (1985), one return equation per rival with event dummies, where the average effect is tested as a cross-equation restriction. The portfolio approach naturally absorbs within-event cross-correlation but is less powerful; the firm-level approach is more powerful but requires a robust test; the MVRM is preferred when the rival set is small and fixed and you want direct cross-firm hypothesis tests. Report value-weighted as primary and equal-weighted as a robustness check, since equal weighting over-weights small peers and can flip the net sign.
- Identify the event date per event type, and use the two-date template where it applies. Bankruptcy uses the Chapter 11 filing date (and ideally the earlier distress or default date, since markets often price distress before the formal filing); mergers use the first proposal or announcement date, with separate windows for an antitrust complaint or completion; earnings use the announcer's release date; dividends use the declaration date. Many focal events have two information dates whose sequence of rival-CAR signs discriminates hypotheses: merger proposal plus antitrust ruling (Eckbo); clinical readout plus FDA approval; recall announcement plus regulator investigation; distress date plus formal filing. Because of leakage and anticipation, windows that start several days early (for example [-5,+1], [-1,+1], [0,+1]) are appropriate alongside a short symmetric window.
- Handle event-date clustering and cross-sectional correlation. This is the single biggest statistical pitfall of intra-industry designs. Rivals share the same calendar event date, so their abnormal returns are contemporaneously correlated; even small cross-correlation badly over-rejects the null and produces spurious significance. Be precise about what each test solves: the standardized cross-sectional Boehmer, Musumeci and Poulsen (1991) (BMP) test corrects event-induced variance but still assumes cross-sectional independence, so for clustered rivals it is necessary but not sufficient; the Kolari and Pynnonen (2010) adjusted-Patell and adjusted-BMP statistics scale by the factor that defeats clustering, the square root of (1 minus rbar) over (1 plus (n minus 1) times rbar), where rbar is the average pairwise cross-correlation of estimation-window residuals and n the number of rivals. The factor makes plain why even small rbar with large n collapses the effective sample size.
- Add nonparametric and thin-trading robustness. Rival sets routinely include small, thinly traded, skewed peers, where parametric and even standardized tests are mis-specified. Report the Corrado (1989) rank test or a generalized sign test alongside the parametric statistics, since the rank test needs no symmetry and is better specified and more powerful under the alternative; Kolari and Pynnonen (2011) provide a rank test robust to both event-induced volatility and cross-correlation. De-bias the market-model beta for thinly traded peers with Scholes-Williams (1977) or Dimson (1979) lead-lag betas, or apply a trading-frequency screen over the estimation window.
- Separate competitive from contagion effects in the cross-section, not the average. The average net reaction hides the two forces. Regress rival CARs on industry concentration (Herfindahl), peer and industry leverage, peer-to-announcer return correlation or product similarity, relative size, and the event's surprise. A positive coefficient on concentration and a negative coefficient on leverage is the Lang and Stulz signature of the competitive effect dominating.
- Screen for confounding. A peer may have its own news in the window: screen out rivals with overlapping events, and on the announcer side screen for simultaneous earnings, M&A, or financing news. Watch survivorship: delisted bankrupt or acquired firms must stay in the announcing sample, but peers must be alive over the estimation window; small peers may trade thinly.
- Choose the benchmark and statistics to match the horizon. Estimate normal returns with a market model (or a market-and-industry model) over a clean estimation window, commonly around 250 trading days ending well before the event (Lang and Stulz estimate from -250 to -50 days before the first distress signal so anticipatory leakage does not contaminate the benchmark). Keep windows short for the competitive-versus-contagion split, where benchmark-model choice is second-order; reserve buy-and-hold or calendar-time methods, which are mis-specified and low-power over long horizons, for persistence questions only. See our significance tests documentation and the expected return models overview; full sources are in the references.
- Triangulate price with volume and volatility, and treat them as primary power, not mere robustness. Because the net rival reaction is the small difference of two large offsetting forces, mean-CAR tests are low-power here by construction. In the Beaver volume-reaction tradition, abnormal trading volume (AVC) and abnormal return volatility (AVyC) among rivals are often the most reliable detector that genuine information transfer occurred, showing up even when the mean CAR is near zero and separating an information-driven re-pricing from a pure liquidity blip.
- Re-estimate per sample period. Cross-firm spillover and predictability magnitudes are sample-dependent; some have decayed (Cohen-Frazzini-style predictability) while others have grown (breach contagion). Do not import canonical 1980s and 1990s magnitudes onto a modern sample; re-estimate, and expect that sharper competitor identification can flip the net sign.
Estimation defaults at a glance
| Design choice | Default |
|---|---|
| Estimation window | -250 to -46 trading days (ending well before any distress or leakage) |
| Event windows | [0,+1] and [-1,+1] primary; [-5,+1] for leakage |
| Expected-return model | Market model, or market-and-industry model |
| Primary statistic | Kolari-Pynnonen adjusted BMP (handles event-induced variance and cross-correlation) |
| Nonparametric check | Corrado rank test or generalized sign test |
| Aggregation | Value-weighted rival portfolio primary; equal-weighted and MVRM as robustness |
| Thin-trading fix | Scholes-Williams or Dimson betas; trading-frequency screen |
A worked example: decomposing one rival's CAR
Suppose the question is whether the bankruptcy of a major carrier hurts its rivals (contagion) or hands them market share (competitive effect). The setup translates directly into an ARC request file, and a single rival's number shows how the two forces net out.
- Focal event and day 0. The carrier's Chapter 11 filing date is day 0. A second specification uses the earlier distress date (covenant default or trading halt), since markets often price the failure before the formal filing.
- Rival set. The other large U.S. carriers, each entered as its own row in the request file, with the bankrupt carrier excluded. Refine the SIC-based set with TNIC similarity so regional or cargo-only operators do not dilute the head-to-head competitors.
- Aggregation. Build a value-weighted rival portfolio as the primary specification (one return series per event), with an equal-weighted firm-level run as a robustness check.
- Windows. Estimation window from -250 to -50 trading days before the distress date; event windows of [-1,+1] and [0,+1] for the clean reaction, plus [-5,+1] to capture leakage.
- Model and tests. Market model (or market-and-industry model) for normal returns; the Kolari and Pynnonen adjusted BMP statistic to defeat the cross-sectional correlation that arises because every rival shares the same event date.
The arithmetic. Take one surviving carrier over the [-1,+1] window. Its actual realized return is -0.4%. The market model, fitted over the estimation window, predicts a normal return of +0.6% given how the overall market moved on those days. The abnormal return is therefore the actual minus the expected:
CAR = (-0.4%) minus (+0.6%) = -1.0%.
That single observed -1.0% is the net of two latent forces. Conceptually, this rival faced a competitive (business-stealing) pull of about +1.5% (it expects to absorb some of the failed carrier's routes and slots) and a contagion pull of about -2.5% (the market marks down the whole sector on fears of weak demand and high fuel and lease leverage). The two net to the observed -1.0%, a small negative number that, taken alone, understates how much information actually moved. This is exactly why the mean CAR is a low-power test here and why abnormal volume and volatility (AVC and AVyC) matter: they confirm that real information transfer occurred even though the price effect is the small residual of two large pulls. To recover the split rather than guess it, regress each rival's CAR cross-sectionally on the Herfindahl index, industry and own leverage, and similarity to the failed carrier: the Lang and Stulz signature is a positive coefficient on concentration and a negative coefficient on leverage, the competitive effect surfacing as the industry gets more concentrated and less levered. The airline-versus-railroad contrast is the empirical precedent for the expected sign: surviving airlines have historically earned significantly positive (competitive) rival returns around carrier bankruptcies, whereas railroad rivals have earned significantly negative (contagion) returns.
Run it with our tools
Our calculators implement this workflow end to end and are free to use. Each maps to a named practitioner workflow:
- Abnormal Return Calculator (ARC): the core tool, and the merger-economist or expert-witness rival-CAR run. Build a request file of event dates, define the rival set (one row per rival, the announcer excluded), pick the estimation and event windows, choose the market or factor model, and select the test statistics. ARC implements the Kolari and Pynnonen adjusted Patell and adjusted BMP tests, which directly solve the cross-sectional correlation induced by clustering rivals on a common event date, plus nonparametric checks for small, skewed peers. Add a Herfindahl-concentration and leverage variable for the cross-sectional regression that separates the competitive from the contagion effect.
- Abnormal Volume Calculator (AVC) and Volatility Calculator (AVyC): confirm that real information transfer occurred when the net price signal is washed out by the two offsetting forces (the usual case here), by measuring abnormal trading volume and volatility around the focal event. Treat these as primary power, not afterthoughts.
- News Analytics (CATA): competitive-intelligence coding of rivals' action streams at scale, operationalizing the structured-content-analysis method (Smith, Ferrier and Ndofor, 2001) used to identify which rivals act and react and why.
- Event Date Identifier (EDI): pin the proposal versus antitrust-complaint versus filing dates that the two-date regulator design needs. Given event-specific timelines, EDI parses large volumes of press releases and returns the dates mentioned in the text, helping you fix the correct day 0 for each event.
Data sources note. A clean rival event study needs three inputs: dated events, a defensible competitor set, and price (or volume) series. Event dates come from regulatory filings (PACER and court dockets for bankruptcies, SEC EDGAR for merger and earnings dates, the FDA approvals database for drug decisions, state breach-notification registries for cyber incidents) and, for the antitrust workflow, from DOJ and FTC press releases that supply both the proposal and the challenge dates. Competitor sets come from SIC and NAICS codes plus the publicly downloadable TNIC similarity data of Hoberg and Phillips, and, for the regulator design, an unaffected-geographic-market rival group as a control. Returns and volume come from your market-data provider; whichever source you use, feed consistently formatted dates into EDI and consistently formatted identifiers into ARC, AVC, and AVyC.
Common pitfalls and misconceptions
- "A near-zero average rival reaction means nothing happened." False. The net reaction is two large offsetting forces (contagion and competitive) netting out, so a small mean CAR can sit on top of substantial information transfer. Triangulate with abnormal volume (AVC) and volatility (AVyC), and split rivals by predicted sign before averaging.
- "Just t-test the average rival CAR." False. Rivals share a common event date, which induces cross-sectional correlation that severely over-rejects the null. Use the Kolari-Pynnonen adjusted BMP or adjusted Patell statistic, or a portfolio or MVRM design.
- "Positive rival returns at a merger prove collusion." False (Eckbo, 1983). Positive returns at the proposal are consistent with both collusion and efficiency; the discriminating test is the non-reaction when an antitrust complaint blocks the deal. Run both dates.
- "SIC codes define my rivals." Coarse. TNIC sharpens the set toward genuine competitors and can flip the measured net sign from contagion to competitive (Klein, 2020).
- "Use the bankruptcy filing date." Incomplete. Markets price distress earlier, so include a pre-distress window and, ideally, the earlier default or distress date as a second day 0.
- "The canonical magnitudes will hold on my sample." Not guaranteed. Cross-firm effects are sample-dependent; some have decayed and others grown. Re-estimate on current data.
Frequently asked questions
What is the difference between a contagion effect and a competitive effect?
A contagion (information-spillover) effect moves rivals in the same direction as the announcing firm, because the news revises beliefs about the whole industry. A competitive (business-stealing or market-power) effect moves rivals in the opposite direction, because one firm's loss is another's gain. The observed rival reaction is the net of the two, so its sign is an empirical test, not an assumption (Lang and Stulz, 1992).
Why are rival abnormal returns usually so small?
Because the net reaction is the difference of two large offsetting forces, the price signal is often a small residual. That is why mean-CAR tests are low-power for this question and why abnormal volume and volatility (AVC and AVyC) are frequently the more reliable evidence that information actually transferred.
If a competitor goes bankrupt, should my stock go up or down?
It depends on industry structure. On average rivals lose about 1% (contagion dominates), but in highly concentrated, low-leverage industries the reaction is significantly positive, about +2.2%, as survivors absorb the failing firm's business (Lang and Stulz, 1992). The closer and more contestable the failing firm's market share, the more likely the competitive (positive) effect dominates.
How do I choose the right set of rivals, SIC or TNIC?
SIC and NAICS codes are a coarse starting point. The Text-based Network Industry Classification (TNIC) of Hoberg and Phillips (2016) builds firm-by-firm similarity from 10-K product text and identifies genuine competitors better; switching to TNIC can change which firms count and even flip the measured net sign (Klein, 2020).
Why can't I just t-test the average rival CAR?
Because rivals share a common event date, their abnormal returns are cross-sectionally correlated, and even small correlation makes a naive t-test over-reject and report spurious significance. Use a cross-correlation-robust statistic (Kolari-Pynnonen adjusted BMP or adjusted Patell), a rival portfolio, or a multivariate regression (SUR) design.
Does a positive rival return after a merger prove the deal is collusive?
No. Positive rival returns at the proposal are consistent with both collusion and efficiency. The decisive test is whether rivals fall when an antitrust complaint blocks the deal: in Eckbo (1983) they did not, which rejects collusion. Positive rival returns alone are a screen, not proof of consumer harm.
Do the 1990s magnitudes still hold today?
Treat them as a prior, not a fact. Canonical signs largely replicate, but magnitudes are sample-dependent: some cross-firm predictability has decayed (Cohen and Frazzini, 2008, and later re-examinations), while breach contagion has grown over time. Re-estimate on your own sample period.
Mini-glossary
- Contagion effect
- A same-direction spillover: one firm's news re-rates the whole industry.
- Competitive (business-stealing) effect
- An opposite-direction spillover: one firm's loss is a rival's gain (or one firm's gain is a rival's threat).
- AMC
- Awareness-motivation-capability, the framework (Chen, 1996) for predicting which rivals respond to a competitive move.
- Market commonality
- The overlap and importance of the markets two firms share; a driver of competitive tension and motivation to respond.
- Resource similarity
- How alike two firms' resource endowments are; a proxy for the capability to respond.
- TNIC
- Text-based Network Industry Classification: firm-by-firm competitor similarity scores built from 10-K product descriptions.
Related use cases
Rival reactions are the spillover side of corporate-event applications studied directly elsewhere. See mergers and acquisitions and divestitures (the focal-firm transactions whose rivals this page studies), alliances and joint ventures, earnings announcements (the origin of the information-transfer literature), litigation and securities fraud (the same machinery applied to materiality and loss causation), and industry clockspeed monitoring. For the full catalogue of applications, return to the overview of practical applications.
References
- Akhigbe, A., and J. Madura. 1999. "Intra-industry effects of bank acquisitions." Journal of Financial Research, 22(3): 367-384.
- Ali, S., et al. 2022. "A meta-analysis of the factors influencing the impact of security breach announcements on stock returns of firms." Electronic Markets, 32(4): 2225-2246. https://doi.org/10.1007/s12525-022-00550-2
- Andrevski, G., and W. J. Ferrier. 2019. "Does it pay to compete aggressively? Contingent roles of internal and external resources." Journal of Management, 45(2): 620-644. https://doi.org/10.1177/0149206316673718
- Bettis, R. A., and D. Weeks. 1987. "Financial returns and strategic interaction: The case of instant photography." Strategic Management Journal, 8: 549-563. https://doi.org/10.1002/smj.4250080605
- Binder, J. J. 1985. "On the use of the multivariate regression model in event studies." Journal of Accounting Research, 23(1): 370-383. https://doi.org/10.2307/2490925
- Boehmer, E., J. Musumeci, and A. B. Poulsen. 1991. "Event-study methodology under conditions of event-induced variance." Journal of Financial Economics, 30(2): 253-272. https://doi.org/10.1016/0304-405X(91)90032-F
- Chen, Ming-Jer. 1996. "Competitor analysis and interfirm rivalry: Toward a theoretical integration." Academy of Management Review, 21: 100-134. https://doi.org/10.2307/258631
- Chen, Ming-Jer. 2009. "Competitive dynamics research: An insider's odyssey." Asia Pacific Journal of Management, 26(1): 5-25. https://doi.org/10.1007/s10490-009-9133-8
- Chen, Ming-Jer, and D. C. Hambrick. 1995. "Speed, stealth, and selective attack: How small firms differ from large firms in competitive behavior." Academy of Management Journal, 38: 453-482. https://doi.org/10.2307/256688
- Chen, Ming-Jer, and D. Miller. 1994. "Competitive attack, retaliation, and performance: An expectancy-valence framework." Strategic Management Journal, 15: 85-102. https://doi.org/10.1002/smj.4250150202
- Chen, Ming-Jer, K. D. Smith, and C. M. Grimm. 1992. "Action characteristics as predictors of competitive responses." Management Science, 38: 439-455. https://doi.org/10.1287/mnsc.38.3.439
- Cohen, L., and A. Frazzini. 2008. "Economic links and predictable returns." Journal of Finance, 63(4): 1977-2011. https://doi.org/10.1111/j.1540-6261.2008.01379.x
- Corrado, C. J. 1989. "A nonparametric test for abnormal security-price performance in event studies." Journal of Financial Economics, 23(2): 385-395. https://doi.org/10.1016/0304-405X(89)90064-0
- Dimson, E. 1979. "Risk measurement when shares are subject to infrequent trading." Journal of Financial Economics, 7(2): 197-226. https://doi.org/10.1016/0304-405X(79)90013-8
- Eckbo, B. E. 1983. "Horizontal mergers, collusion, and stockholder wealth." Journal of Financial Economics, 11(1-4): 241-273. https://doi.org/10.1016/0304-405X(83)90013-2
- Ferrier, W. J. 2001. "Navigating the competitive landscape: The drivers and consequences of competitive aggressiveness." Academy of Management Journal, 44: 858-877. https://doi.org/10.2307/3069419
- Ferrier, W. J., and H. Lee. 2002. "Strategic aggressiveness, variation, and surprise: How the sequential pattern of competitive rivalry influences stock market returns." Journal of Managerial Issues, 14: 162-180.
- Ferrier, W. J., K. G. Smith, and C. M. Grimm. 1999. "The role of competitive action in market share erosion and industry dethronement: A study of industry leaders and challengers." Academy of Management Journal, 42: 372-388. https://doi.org/10.2307/257009
- Ferris, S. P., N. Jayaraman, and A. K. Makhija. 1997. "The response of competitors to announcements of bankruptcy: An empirical examination of contagion and competitive effects." Journal of Corporate Finance, 3(4): 367-395. https://doi.org/10.1016/S0929-1199(97)00006-0
- Foster, G. 1981. "Intra-industry information transfers associated with earnings releases." Journal of Accounting and Economics, 3(3): 201-232. https://doi.org/10.1016/0165-4101(81)90003-3
- Gimeno, J., and C. Y. Woo. 1996. "Hypercompetition in a multimarket environment: The role of strategic similarity and multimarket contact in competitive de-escalation." Organization Science, 7: 322-341. https://doi.org/10.1287/orsc.7.3.322
- Hertzel, M. G., Z. Li, M. S. Officer, and K. J. Rodgers. 2008. "Inter-firm linkages and the wealth effects of financial distress along the supply chain." Journal of Financial Economics, 87(2): 374-387. https://doi.org/10.1016/j.jfineco.2007.01.005
- Hoberg, G., and G. Phillips. 2016. "Text-based network industries and endogenous product differentiation." Journal of Political Economy, 124(5): 1423-1465. https://doi.org/10.1086/688176
- Hughes-Morgan, M., K. Kolev, and G. McNamara. 2018. "A meta-analytic review of competitive aggressiveness research." Journal of Business Research, 85: 73-82. https://doi.org/10.1016/j.jbusres.2017.10.053
- Kashmiri, S., C. D. Nicol, and L. Hsu. 2017. "Birds of a feather: Intra-industry spillover of the Target customer data breach and the shielding role of IT, marketing, and CSR." Journal of the Academy of Marketing Science, 45(2): 208-228. https://doi.org/10.1007/s11747-016-0486-5
- Ketchen, D. J., C. C. Snow, and V. L. Hoover. 2004. "Research on competitive dynamics: Recent accomplishments and future challenges." Journal of Management, 30(6): 779-804. https://doi.org/10.1016/j.jm.2004.06.002
- Kirzner, I. 1973. Competition and Entrepreneurship. Chicago: University of Chicago Press.
- Kirzner, I. M. 1997. "Entrepreneurial discovery and the competitive market process: An Austrian approach." Journal of Economic Literature, 35(1): 60-85.
- Klein, T. 2020. "Event studies in merger analysis: Review and an application using U.S. TNIC data." Tinbergen Institute Discussion Paper 2020-005. https://papers.tinbergen.nl/20005.pdf
- Kolari, J. W., and S. Pynnonen. 2010. "Event study testing with cross-sectional correlation of abnormal returns." Review of Financial Studies, 23(11): 3996-4025. https://doi.org/10.1093/rfs/hhq072
- Kolari, J. W., and S. Pynnonen. 2011. "Nonparametric rank tests for event studies." Journal of Empirical Finance, 18(5): 953-971. https://doi.org/10.1016/j.jempfin.2011.08.003
- Lang, L. H. P., and R. M. Stulz. 1992. "Contagion and competitive intra-industry effects of bankruptcy announcements: An empirical analysis." Journal of Financial Economics, 32(1): 45-60. https://doi.org/10.1016/0304-405X(92)90024-R
- Laux, P., L. T. Starks, and P. S. Yoon. 1998. "The relative importance of competition and contagion in intra-industry information transfers: An investigation of dividend announcements." Financial Management, 27(3): 5-16. https://doi.org/10.2307/3666270
- MacMillan, I., M. McCaffrey, and G. Van Wijk. 1985. "Competitors' responses to easily imitated new products: Exploring commercial banking product introductions." Strategic Management Journal, 6: 75-86. https://doi.org/10.1002/smj.4250060107
- Miller, D., and Ming-Jer Chen. 1994. "Sources and consequences of competitive inertia: A study of the U.S. airline industry." Administrative Science Quarterly, 39(1): 1-23. https://doi.org/10.2307/2393492
- Mises, L. 1949. Human Action: A Treatise on Economics. New Haven: Yale University Press.
- Porter, M. 1979. "The structure within industries and companies' performance." Review of Economics and Statistics, 61: 214-227. https://doi.org/10.2307/1924589
- Rindova, V., W. J. Ferrier, and R. Wiltbank. 2010. "Value from gestalt: How sequences of competitive actions create advantage for firms in nascent markets." Strategic Management Journal, 31(13): 1474-1497. https://doi.org/10.1002/smj.892
- Schimmer, M. 2012. "Essays on competitive dynamics: Strategic groups, competitive moves and performance within the global insurance industry." Dissertation, University of St. Gallen, St. Gallen. https://doi.org/10.1007/978-3-8349-3992-0
- Schipper, K., and R. Thompson. 1983. "The impact of merger-related regulations on the shareholders of acquiring firms." Journal of Accounting Research, 21(1): 184-221. https://doi.org/10.2307/2490942
- Scholes, M., and J. Williams. 1977. "Estimating betas from nonsynchronous data." Journal of Financial Economics, 5(3): 309-327. https://doi.org/10.1016/0304-405X(77)90041-1
- Schumpeter, J. 1943. Capitalism, Socialism, and Democracy. New York: Harper. https://doi.org/10.2307/2226398
- Smith, K. G., W. J. Ferrier, and H. Ndofor. 2001. "Competitive dynamics research: Critique and future directions." In M. A. Hitt, R. E. Freeman, and J. S. Harrison (eds.), Handbook of Strategic Management, 315-361. Oxford: Blackwell. https://doi.org/10.1111/b.9780631218616.2006.00012.x
- Song, M. H., and R. A. Walkling. 2000. "Abnormal returns to rivals of acquisition targets: A test of the acquisition probability hypothesis." Journal of Financial Economics, 55(2): 143-171. https://doi.org/10.1016/S0304-405X(99)00048-3
- Tan, Q., et al. 2019. "Competitive earnings news and post-earnings announcement drift." International Review of Financial Analysis, 63: 331-343. https://doi.org/10.1016/j.irfa.2018.12.006
- Thomas, H., and T. Pollock. 1999. "From I-O economics' S-C-P paradigm through strategic groups to competence-based competition: Reflections on the puzzle of competitive strategy." British Journal of Management, 10(2): 127-140. https://doi.org/10.1111/1467-8551.00115
- Warren-Boulton, F., and S. Dalkir. 2001. "Staples and Office Depot: An event-probability case study." Review of Industrial Organization, 19(4): 467-479. https://doi.org/10.1023/A:1012548125974
- Young, G., K. G. Smith, and C. M. Grimm. 1996. "'Austrian' and industrial organization perspectives on firm-level competitive activity and performance." Organization Science, 7: 243-254. https://doi.org/10.1287/orsc.7.3.243
Further readings
- Chen, Ming-Jer. 1988. "Competitive strategic interaction: A study of competitive actions and responses." Unpublished doctoral dissertation, University of Maryland.
- Chen, Ming-Jer, and I. MacMillan. 1992. "Nonresponse and delayed response to competitive moves: The roles of competitor dependence and action irreversibility." Academy of Management Journal, 35: 539-570. https://doi.org/10.2307/256486
- Eckbo, B. E. 1989. "The role of stock market studies in formulating antitrust policy toward horizontal mergers." Quarterly Journal of Business and Economics, 28(1): 22-38.
- Hambrick, D. C., T. Cho, and Ming-Jer Chen. 1996. "The influence of top management team heterogeneity on firms' competitive moves." Administrative Science Quarterly, 41: 659-684. https://doi.org/10.2307/2393871
- Hsieh, K.-Y., and Ming-Jer Chen. 2010. "Responding to rivals' actions: Beyond dyadic conceptualization of interfirm rivalry." 2010 Academy of Management Annual Meeting. Montreal, Canada.
- Kolari, J. W., B. Pape, and S. Pynnonen. 2018. "Event study testing with cross-sectional correlation due to partially overlapping event windows." Working paper. https://papers.ssrn.com/sol3/papers.cfm?abstract_id=3167271
- Miller, D., and Ming-Jer Chen. 1996. "Nonconformity in competitive repertoires: A sociological view of markets." Social Forces, 74: 1209-1234. https://doi.org/10.2307/2580349
- Miller, D., and Ming-Jer Chen. 1996. "The simplicity of competitive repertoires: An empirical analysis." Strategic Management Journal, 17(6): 419-439. https://doi.org/10.1002/(sici)1097-0266(199606)17:6419::aid-smj818>3.0.co;2-z
- Zucchini, L., and T. Kretschmer. 2011. "Competitive pressure: Competitive dynamics as reactions to multiple rivals." Annual Meeting of the Academy of Management. San Antonio, TX.
See the full bibliography for all sources cited across the site.